Mar 13, 2010
4th Wave Studies With the DOW '00-'03
Still see the same pattern for long term 4th waves in this chart.

4th Wave Studies With GLD
I figured this was a great time to do some analysis of 4th waves since the RVX seems to be completing one right now. This is the GLD in 2008 completing a long term 4th wave. Even with the 2 day chart you can clearly make out the counts. The question I have now is, do all 4th waves have this pattern, or only within a C wave? I need to determine if GLD is in a long term C, or a long term 5th wave with further analysis.


Mar 12, 2010
See, I'm Not a Perma-Bear. Well, Kind of.....
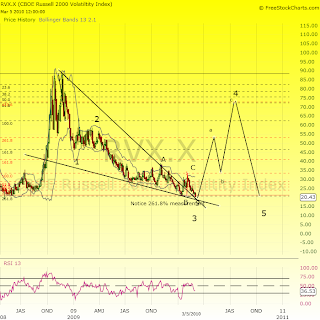
The RVX is taking a C wave shaped bounce right now, probably to the 25-26 range. This indicates to me that there is still a 5th wave down in the RVX to go, indicating at least a sizeable rally, whether the highs will be broken is another question. I have heard 692 being kicked around on other blogs. I also tried to match up the Fib measurement from the post that I made earlier using as a comparison. It was cut off, but potential 5th wave targets would be between 692 and 700 in this scenario. I don't want to think about the 23.6 retracement from the all-time highs at 733 unless I am free to switch into TNA due to a family member's illness.


Here is a repost of the earlier measurement:

Shrinking Bullishness and 5th Wave Endings
I believe this is still the "shrinking" 5th wave pattern that I am seeing as they are identical in count but getting smaller with each progression. The B wave today did not make a new high, so it is very possible the high has already been made. By the time factor that I labeled, the bulls don't have much time left to break above it.


Are We There Yet?
I keep counting this pattern over and over again. It is confusing, but the indicators are showing a possible rollover here to support a final 5th wave count.


Mar 11, 2010
5th Wave Pattern with Fibinocci Measurement
This 5th wave was completed just before the recent C wave correction. The measurement is a little tricky compared to our current pattern. The counts don't always go in the direction or distance you think they will within impulsive waves and I believe the measure point is much lower during our current rally from February. Ignore the arrow as this was done for my facebook friends a couple of days ago. I drew a line through each abc(4) pattern to make it a little easier for comparison.


Mar 6, 2010
Trading/Investing Within the ENORMITY of Our Situation
I thought I had a handle on just how large and bad our situation is. Well, this study just made it worse. I went back and compared the length of time of the first phase of this modern day depression. There is an approximately 4.86 times ratio in our situation vs the Great Depression. We need to adjust our time horizon for trading/Investing as there will be a great time to get long after the next big drop. This would also concur with my $8-10 Citigroup target. I could not for the life of me convince myself that Citigroup could go this high in our bad situation. The great depression proves that it can, in my opinion. We are just finishing the first little red "a" right now equivalent to Nov-Dec. 1929 and "b" will begin soon. Whether it breaks the March '09 lows in "b" or not is yet to be seen. B wave targets vary so we will just have to count it out on the way down. Click on each pic for larger view.


Here are some other charts just for comparisons:


For those who use Elliot Wave here is an RVX projection chart that I believe confirms the B wave down. A wedge breakout essentially breaks down into a B wave formation after the breakout. Here is my intrepretation.

Here are some other charts just for comparisons:


Mar 5, 2010
A Study of Long Term Rally Ending 5th Waves
I thought it would be good to have something to compare to as a guide into next week. I had to use the 2 day chart to go back to 2007 and the last 5th wave ending rally. I compared to the daily chart currently because this is on a much smaller scale now.
Here is the DOW

 Here is the IWM


Here is the DOW


IWM and RTB 4th Wave Revision
I have been trying to get this nailed down because there is a lot going on in the 4th wave area, with 5th wave of 3 ending and this abc4 pattern beginning. I made some corrective changes to my chart and I believe this is right because it looks more like a traditional 4th wave, it's just that it's broken down into a measureable pattern.

Feb 27, 2010
The Volatile DXY
There is usually either a direct or inverse relationship between between the dollar and the markets. I felt it was a good idea to see what was going to happen over the next 10 or so years to have an idea of what we are in for. This was actually one of the easiest charts that I have worked with. I feel very confident in these projections.
Here is an intermediate term chart that may cover the next 2-3years depending on how fast the movement is.


Here is an intermediate term chart that may cover the next 2-3years depending on how fast the movement is.

Then, I took this short term chart and applied the projections to a Monthly chart. Unfortunately, my charts don't go back far enough to give a projection once the dollar bottoms. 46 on the DXY, I guess things will get more expensive won't they?

Feb 26, 2010
How to Identify a C wave and Measure for Target
I am sure many are trying to figure out why I am so bearish and comfortable holding on to my 10.96 TZA goof. I should have known wave 4 would go much higher than it has. In my first example it doesn't retrace as high as most. I would also like to show you the beauty of Elliot Wave when combined with fibinocci measurements. Prechter has been wrong his predictions because in traditional elliot wave, there is no real way to count c waves. The problem is within a C wave, every 4th and 5th wave have an ABC pattern that extends them beyond their normal targets. You can see how over months or years this would throw off any prediction if you didn't know what to look for. I posted the link to the new rules in the facebook links section for anyone who wants to download the free e-book.


I figured I would start with the C wave of 5 that ended the trading day today using a 1 minute chart. Notice the 423.6% target measured by the first 3 waves. I labeled the last projection, "wave 5 from March" because this is essentially the same pattern and to illustrate how we need to play the rest of the year.

Now see if you see the resemblance in the 60min chart. I apologize for the labeling, the last time I tried to delete them on one chart, my program deleted them all my formats.

Now, for the grand finale, to really illustrate the beauty of Elliot Wave, here is the Dow from 2007 using the same technique and fibinocci measurement. No matter the scale, the pattern and measurements are the same. In red I performed the same measurement, and it appears we will get the double-top that many have been looking for, but it will take a while to get there. The bottom target specifically is 3355.

IWM 2/26- Will we make a new high on Monday?
The action today was just a continuation from yesterday and is still within my wave 2 of 1 of 5 guidelines. If the 633.5 holds on Monday this count is accurate. Otherwise, there is still the possiblity of moving the C4 of 4 over one wave and this current wave would be wave 5 of 4 of C instead.


Feb 25, 2010
30 Year Treasury Yield Since 1980
I was just playing around last night and did some wave counts for the 30 year Treasury Index. It's not inverse as most charts, the up and down correlate with the interest rate. Notice how close we have come to the 261.8% normal 5 wave target? Looks to be 5-10 years before it bottoms.

IWM 2/25 Could This Be the Start of the Run to 550's?
Unless a new high is made tomorrow, I am sticking with my original counts (from facebook yesterday). If a new high is made, then C4 would just get slid over 1 more wave, but the bulls still can't get away.

Feb 22, 2010

Subscribe to:
Posts (Atom)