I thought I had a handle on just how large and bad our situation is. Well, this study just made it worse. I went back and compared the length of time of the first phase of this modern day depression. There is an approximately 4.86 times ratio in our situation vs the Great Depression. We need to adjust our time horizon for trading/Investing as there will be a great time to get long after the next big drop. This would also concur with my $8-10 Citigroup target. I could not for the life of me convince myself that Citigroup could go this high in our bad situation. The great depression proves that it can, in my opinion. We are just finishing the first little red "a" right now equivalent to Nov-Dec. 1929 and "b" will begin soon. Whether it breaks the March '09 lows in "b" or not is yet to be seen. B wave targets vary so we will just have to count it out on the way down. Click on each pic for larger view.


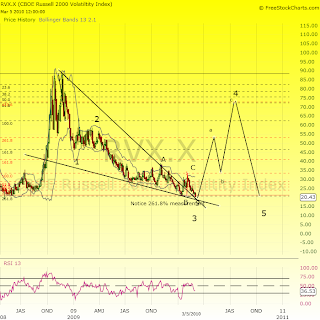
For those who use Elliot Wave here is an RVX projection chart that I believe confirms the B wave down. A wedge breakout essentially breaks down into a B wave formation after the breakout. Here is my intrepretation.
Here are some other charts just for comparisons:


No comments:
Post a Comment