Mar 12, 2010
Are We There Yet?
I keep counting this pattern over and over again. It is confusing, but the indicators are showing a possible rollover here to support a final 5th wave count.


Mar 11, 2010
5th Wave Pattern with Fibinocci Measurement
This 5th wave was completed just before the recent C wave correction. The measurement is a little tricky compared to our current pattern. The counts don't always go in the direction or distance you think they will within impulsive waves and I believe the measure point is much lower during our current rally from February. Ignore the arrow as this was done for my facebook friends a couple of days ago. I drew a line through each abc(4) pattern to make it a little easier for comparison.


Mar 6, 2010
Trading/Investing Within the ENORMITY of Our Situation
I thought I had a handle on just how large and bad our situation is. Well, this study just made it worse. I went back and compared the length of time of the first phase of this modern day depression. There is an approximately 4.86 times ratio in our situation vs the Great Depression. We need to adjust our time horizon for trading/Investing as there will be a great time to get long after the next big drop. This would also concur with my $8-10 Citigroup target. I could not for the life of me convince myself that Citigroup could go this high in our bad situation. The great depression proves that it can, in my opinion. We are just finishing the first little red "a" right now equivalent to Nov-Dec. 1929 and "b" will begin soon. Whether it breaks the March '09 lows in "b" or not is yet to be seen. B wave targets vary so we will just have to count it out on the way down. Click on each pic for larger view.


Here are some other charts just for comparisons:


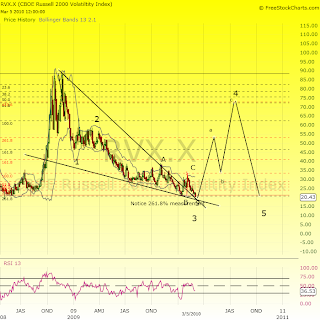
For those who use Elliot Wave here is an RVX projection chart that I believe confirms the B wave down. A wedge breakout essentially breaks down into a B wave formation after the breakout. Here is my intrepretation.

Here are some other charts just for comparisons:


Mar 5, 2010
A Study of Long Term Rally Ending 5th Waves
I thought it would be good to have something to compare to as a guide into next week. I had to use the 2 day chart to go back to 2007 and the last 5th wave ending rally. I compared to the daily chart currently because this is on a much smaller scale now.
Here is the DOW

 Here is the IWM


Here is the DOW


IWM and RTB 4th Wave Revision
I have been trying to get this nailed down because there is a lot going on in the 4th wave area, with 5th wave of 3 ending and this abc4 pattern beginning. I made some corrective changes to my chart and I believe this is right because it looks more like a traditional 4th wave, it's just that it's broken down into a measureable pattern.

Subscribe to:
Posts (Atom)